קובץ:StationaryStatesAnimation.gif

תוכן הדף אינו נתמך בשפות אחרות.
מתוך ויקיפדיה, האנציקלופדיה החופשית

StationaryStatesAnimation.gif(300 × 280 פיקסלים, גודל הקובץ: 223 ק"ב, סוג MIME‏: image/gif, בלולאה, 41 תמונות)

ויקישיתוף זהו קובץ שמקורו במיזם ויקישיתוף. תיאורו בדף תיאור הקובץ המקורי (בעברית) מוצג למטה.

תקציר

תיאור
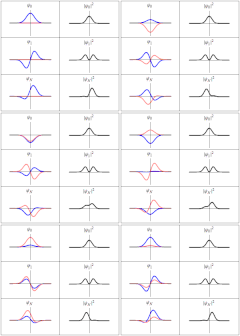
English: Three wavefunction solutions to the Time-Dependent Schrödinger equation for a harmonic oscillator. Left: The real part (blue) and imaginary part (red) of the wavefunction. Right: The probability of finding the particle at a certain position. The top two rows are the lowest two energy eigenstates, and the bottom is the superposition state , which is not an energy eigenstate. The right column illustrates why energy eigenstates are also called "stationary states".
Thus in every quantum stae,there are certain preferred positions of maximum probability
תאריך יצירה
מקור נוצר על־ידי מעלה היצירה
יוצר Sbyrnes321
(* Source code written in Mathematica 6.0 by Steve Byrnes, Feb. 2011. This source code is public domain. *)
(* Shows classical and quantum trajectory animations for a harmonic potential. Assume m=w=hbar=1. *)
ClearAll["Global`*"]
(*** Wavefunctions of the energy eigenstates ***)
psi[n_, x_] := (2^n*n!)^(-1/2)*Pi^(-1/4)*Exp[-x^2/2]*HermiteH[n, x];
energy[n_] := n + 1/2;
psit[n_, x_, t_] := psi[n, x] Exp[-I*energy[n]*t];
(*** A non-stationary state ***)
SeedRandom[1];
psinonstationary[x_, t_] := (psit[0, x, t]+psit[1, x, t])/Sqrt[2];

(*** Put all the plots together ***)
SetOptions[Plot, {PlotRange -> {-1, 1}, Ticks -> None, PlotStyle -> {Directive[Thick, Blue], Directive[Thick, Pink]}}];
MakeFrame[t_] := GraphicsGrid[
   {{Plot[{Re[psit[0, x, t]], Im[psit[0, x, t]]}, {x, -5, 5}, PlotLabel -> Subscript[\[Psi],0]], 
     Plot[Abs[psit[0, x, t]]^2, {x, -5, 5}, PlotStyle -> Directive[Thick, Black],
		PlotLabel -> TraditionalForm[Abs[Subscript[\[Psi],0]]^2]]},
   {Plot[{Re[psit[1, x, t]], Im[psit[1, x, t]]}, {x, -5, 5}, PlotLabel -> Subscript[\[Psi],1]], 
     Plot[Abs[psit[1, x, t]]^2, {x, -5, 5}, PlotStyle -> Directive[Thick, Black],
		PlotLabel -> TraditionalForm[Abs[Subscript[\[Psi],1]]^2]]},
   {Plot[{Re[psinonstationary[x, t]], Im[psinonstationary[x, t]]}, {x, -5, 5}, PlotLabel -> Subscript[\[Psi],N]], 
     Plot[Abs[psinonstationary[x, t]]^2, {x, -5, 5}, PlotStyle -> Directive[Thick, Black],
		PlotLabel -> TraditionalForm[Abs[Subscript[\[Psi],N]]^2]]}
   }, Frame -> All, ImageSize -> 300];
output = Table[MakeFrame[t], {t, 0, 4 Pi*40/41, 4 Pi/41}];
SetDirectory["C:\\Users\\Steve\\Desktop"]
Export["test.gif", output]

רישיון

אני, בעל זכויות היוצרים על עבודה זו, מפרסם בזאת את העבודה תחת הרישיון הבא:
Creative Commons CC-Zero קובץ זה זמין לפי תנאי הקדשה עולמית לנחלת הכלל CC0 1.0 של Creative Commons.
האדם ששייך יצירה להיתר הזה הקדיש את היצירה לנחלת הכלל על־ידי ויתור על כל הזכויות שלו או שלה על היצירה בכל העולם לפי חוק זכויות יוצרים, לרבות כל הזכויות הקשורות או הסמוכות כקבוע בחוק. באפשרותך להעתיק, לשנות, להפיץ, או להציג את היצירה, אפילו למטרות מסחריות, וכל זה אפילו מבלי לבקש רשות.

כיתובים

נא להוסיף משפט שמסביר מה הקובץ מייצג

פריטים שמוצגים בקובץ הזה

מוצג

היסטוריית הקובץ

ניתן ללחוץ על תאריך/שעה כדי לראות את הקובץ כפי שנראה באותו זמן.

תאריך/שעהתמונה ממוזערתממדיםמשתמשהערה
נוכחית21:21, 20 במרץ 2011תמונה ממוזערת לגרסה מ־21:21, 20 במרץ 2011‪280 × 300‬ (223 ק"ב)Sbyrnes321{{Information |Description ={{en|1=Three wavefunction solutions to the Time-Dependent Schrödinger equation for a harmonic oscillator. Left: The real part (blue) and imaginary part (red) of the wavefunction. Right: The probability of finding the partic

הדף הבא משתמש בקובץ הזה:

שימוש גלובלי בקובץ

אתרי הוויקי השונים הבאים משתמשים בקובץ זה: