
קובץ:Real-tetration.png
גודל התצוגה המקדימה הזאת: 169 × 598 פיקסלים. רזולוציה אחרת: 244 × 864 פיקסלים.
לקובץ המקורי (244 × 864 פיקסלים, גודל הקובץ: 15 ק"ב, סוג MIME: image/png)
| זהו קובץ שמקורו במיזם ויקישיתוף. תיאורו בדף תיאור הקובץ המקורי (בעברית) מוצג למטה. |

|
יש ליצור מחדש את התמונה graph הזו באמצעות גרפיקה וקטורית כדוגמת קובץ SVG. לפעולה זו מספר יתרונות, כפי שניתן לקרוא (באנגלית) בדף Commons:Media for cleanup. אם ברשותכם קובץ SVG, אנא העלו אותו. לאחר מכן, החליפו תבנית זו בתבנית
{{vector version available|שם הקובץ.svg}} |
תקציר
| תיאור |
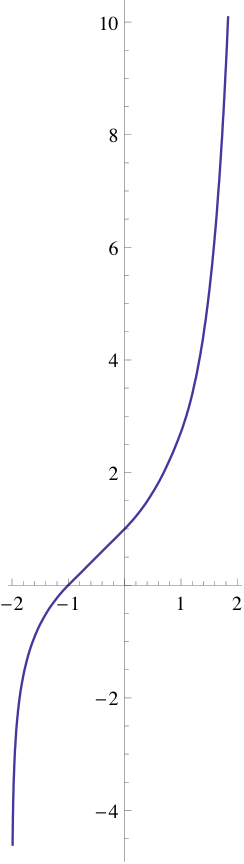
English: Author: Andrew Robbins. I made this with Mathematica. I grant fair use to this image. This is an image of real tetration using the linear approximation. |
| תאריך יצירה | 25 בנובמבר 2007 (תאריך העלאה מקורי) |
| מקור | הועבר מ- en.wikipedia לוויקישיתוף. |
| יוצר | AJRobbins מוויקיפדיה האנגלית |
Plotting with gnuplot
It is possible to plot this in gnuplot with following commands:
set grid
set xr[-4:4]
set yr[-5:15]
set yzeroaxis linetype 7 linewidth 1.5
set xzeroaxis linetype 7 linewidth 1.5
tet(a,n)=(n<0)?((n<-1)?(log(tet(a,n+1))/log(a)):(1.0+((2*log(a))/(1+log(a)))*n-((1-log(a))/(1+log(a)))*n**2)) :(a**tet(a,n-1.0))
e=exp(1)
set xtic 1
set ytic 1
plot tet(e,x)
Above commands can be used to make an .svg version of the plot.
רישיון
| היצירה הזאת שוחררה לנחלת הכלל על־ידי היוצר שלה, AJRobbins מוויקיפדיה האנגלית. זה תקף בכל העולם. יש מדינות שבהן הדבר אינו אפשרי על פי חוק, אם כך: AJRobbins מעניק לכל אחד את הזכות להשתמש ביצירה הזאת לכל מטרה, ללא שום תנאי, אלא אם כן תנאים כאלה נדרשים לפי החוק. |
יומן העלאה מקורי
תיאור הקובץ המקורי נמצא כאן. כל שמות המשתמשים הבאים מתייחסים ל-en.wikipedia.
| תאריך/שעה | ממדים | משתמש | הערה |
|---|---|---|---|
| 2007-11-25 10:48 | 244×864× (15340 bytes) | AJRobbins | Author: Andrew Robbins. I made this with Mathematica. I grant fair use to this image. This is an image of real tetration using the linear approximation. |
היסטוריית הקובץ
ניתן ללחוץ על תאריך/שעה כדי לראות את הקובץ כפי שנראה באותו זמן.
| תאריך/שעה | תמונה ממוזערת | ממדים | משתמש | הערה | |
|---|---|---|---|---|---|
| נוכחית | 17:57, 4 בספטמבר 2014 | 864 × 244 (15 ק"ב) | 05storm26 | Transferred from en.wikipedia |
שימוש בקובץ
הדף הבא משתמש בקובץ הזה:
שימוש גלובלי בקובץ
אתרי הוויקי השונים הבאים משתמשים בקובץ זה:
- שימוש באתר en.wikipedia.org
- שימוש באתר eo.wikipedia.org
- שימוש באתר fa.wikipedia.org
- שימוש באתר hu.wikipedia.org
- שימוש באתר vi.wikipedia.org