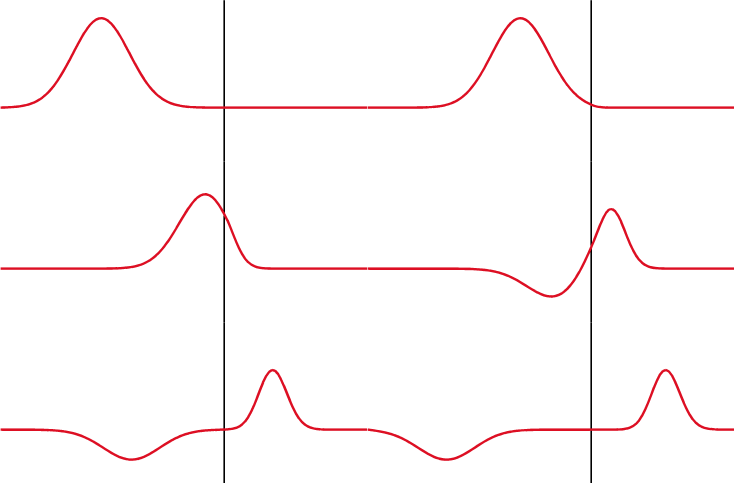
קובץ:Partial transmittance.gif

תוכן הדף אינו נתמך בשפות אחרות.
מתוך ויקיפדיה, האנציקלופדיה החופשית

Partial_transmittance.gif(367 × 161 פיקסלים, גודל הקובץ: 67 ק"ב, סוג MIME‏: image/gif, בלולאה, 53 תמונות, 4.2 שניות)

ויקישיתוף זהו קובץ שמקורו במיזם ויקישיתוף. תיאורו בדף תיאור הקובץ המקורי (בעברית) מוצג למטה.

תקציר

תיאור
Русский: Показано классическое отражение/прохождение солитона гауссового импульса от/в более плотную среду. В реальности же, свет отражается не от поверхности, а от всех частиц тела (см. ru:КЭД).
English: Illustration of partial reflection of a wave. A gaussian wave on a one-dimensional string strikes a boundary with transmission coefficient of 0.5. Half the wave is transmitted and half is reflected.
Français : Illustration de la réflection partielle d'une onde. Une onde gaussienne se déplaçant sur un ressort unidimensionnel est réfléchie/transmise au niveau d'une interface avec un coefficient de transmission de 0.5.
Español: Ilustración de una reflexión parcial de una onda. Una onda gaussiana sobre una cuerda de una dimensión choca contra un limite con un coeficiente de transmisión de 0.5. La mitad de la onda es transmitida y la otra mitad es reflejada.
תאריך יצירה
מקור self-made with MATLAB, source code below
יוצר Oleg Alexandrov
 
. MATLAB עם‎‎ נוצרה ה GIF תמונת מפת סיביות

רישיון

Public domain ברצוני, בעלי זכויות היוצרים על יצירה זו, לשחרר יצירה זו לנחלת הכלל. זה תקף בכל העולם.
יש מדינות שבהן הדבר אינו אפשרי על פי חוק, אם כך:
אני מעניק לכל אחד את הזכות להשתמש בעבודה זו לכל מטרה שהיא, ללא תנאים כלשהם, אלא אם כן תנאים כאלה נדרשים על פי חוק.

MATLAB source code

% Partial transmittance and reflectance of a wave
% Code is messed up, don't have time to clean it now
function main()
 
   % KSmrq's colors
   red    = [0.867 0.06 0.14];
   blue   = [0, 129, 205]/256;
   green  = [0, 200,  70]/256;
   yellow = [254, 194,   0]/256;
   white = 0.99*[1, 1, 1];
   black = [0, 0, 0];
 
   % length of the string and the grid
   L = 5;
   N = 151;
   X=linspace(0, L, N);
 
   h = X(2)-X(1); % space grid size
   c = 0.01; % speed of the wave
   tau = 0.25*h/c; % time grid size
 
   % form a medium with a discontinuous wave speed
   C = 0*X+c;
 
   D=L/2;
   c_right = 0.5*c; % speed to the right of the disc
   for i=1:N
      if X(i) > D
         C(i) = c_right;
      end
   end
   % Now C = c for x < D, and C=c_right for x > D
 
   K = 5; % steepness of the bump
   S = 0; % shift the wave
   f=inline('exp(-K*(x-S).^2)', 'x', 'S', 'K'); % a gaussian as an initial wave
   df=inline('-2*K*(x-S).*exp(-K*(x-S).^2)', 'x', 'S', 'K'); % derivative of f
 
   % wave at time 0 and tau
   U0 = 0*f(X, S, K);
   U1 = U0 - 2*tau*c*df(X, S, K);
 
   U = 0*U0; % current U
 
   % plot between Start and End
   Start=130; End=500;
 
   % hack to capture the first period of the wave
   min_k = 2*N; k_old = min_k; turn_on = 0; 
 
   frame_no = 0;
   for j=1:End
 
      %  fixed end points
      U(1)=0; U(N)=0;
 
      % finite difference discretization in time
      for i=2:(N-1)
         U(i) = (C(i)*tau/h)^2*(U1(i+1)-2*U1(i)+U1(i-1)) + 2*U1(i) - U0(i);
      end
 
      % update info, for the next iteration
      U0 = U1; U1 = U;
 
      spacing=7;
 
     % plot the wave
      if rem(j, spacing) == 1 & j > Start
 
         figure(1); clf; hold on;
         axis equal; axis off; 
         lw = 3; % linewidth
 
         % size of the window
         ys = 1.2;
 
         low = -0.5*ys;
         high = ys;
         plot([D, D], [low, high], 'color', black, 'linewidth', 0.7*lw)
%         fill([X(1), D, D, X(1)], [low, low, high, high], [0.9, 1, 1], 'edgealpha', 0);
%         fill([D X(N), X(N), D],  [low, low, high, high], [1, 1, 1], 'edgealpha', 0);
 
         plot(X, U, 'color', red, 'linewidth', lw);
 
         % plot the ends of the string
         small_rad = 0.06;
 
         axis([-small_rad, 0.82*L, -ys, ys]);
 
         % small markers to keep the bounding box fixed when saving to eps
         plot(-small_rad, ys, '*', 'color', white);
         plot(L+small_rad, -ys, '*', 'color', white);
 
         pause(0.1)
         frame_no = frame_no + 1;
         %frame=sprintf('Frame%d.eps', 1000+frame_no); saveas(gcf, frame, 'psc2');
         frame=sprintf('Frame%d.png', 1000+frame_no);% saveas(gcf, frame);
         disp(frame)
         print (frame, '-dpng', '-r300');
 
      end
   end
 
 
% The gif image was creating with the command
% convert -antialias -loop 10000  -delay 8 -compress LZW -scale 20% Frame10*png Partial_transmittance.gif
% and was later cropped in Gimp

כיתובים

נא להוסיף משפט שמסביר מה הקובץ מייצג

פריטים שמוצגים בקובץ הזה

מוצג

היסטוריית הקובץ

ניתן ללחוץ על תאריך/שעה כדי לראות את הקובץ כפי שנראה באותו זמן.

תאריך/שעהתמונה ממוזערתממדיםמשתמשהערה
נוכחית19:36, 9 באפריל 2010תמונה ממוזערת לגרסה מ־19:36, 9 באפריל 2010‪161 × 367‬ (67 ק"ב)Aiyizooptimized animation
08:56, 26 בנובמבר 2007תמונה ממוזערת לגרסה מ־08:56, 26 בנובמבר 2007‪161 × 367‬ (86 ק"ב)Oleg Alexandrov{{Information |Description=Illustration of en:Transmission coefficient (optics) |Source=self-made with MATLAB, source code below |Date=~~~~~ |Author= Oleg Alexandrov |Permission=PD-self, see below |other_versions= }} {{PD-se

הדפים הבאים משתמשים בקובץ הזה:

שימוש גלובלי בקובץ

אתרי הוויקי השונים הבאים משתמשים בקובץ זה:

צפו בשימושים בקובץ זה במיזמי ויקימדיה נוספים.